Quick start
Welcome to the page with the easiest examples of how to use the estaty library!
Spatial data
Spatial data is something that has coordinates. Such data can be of two types:
- Vector data - geometries with assigned attributed data
- Raster data - pictures where each pixel has it's own spatial location
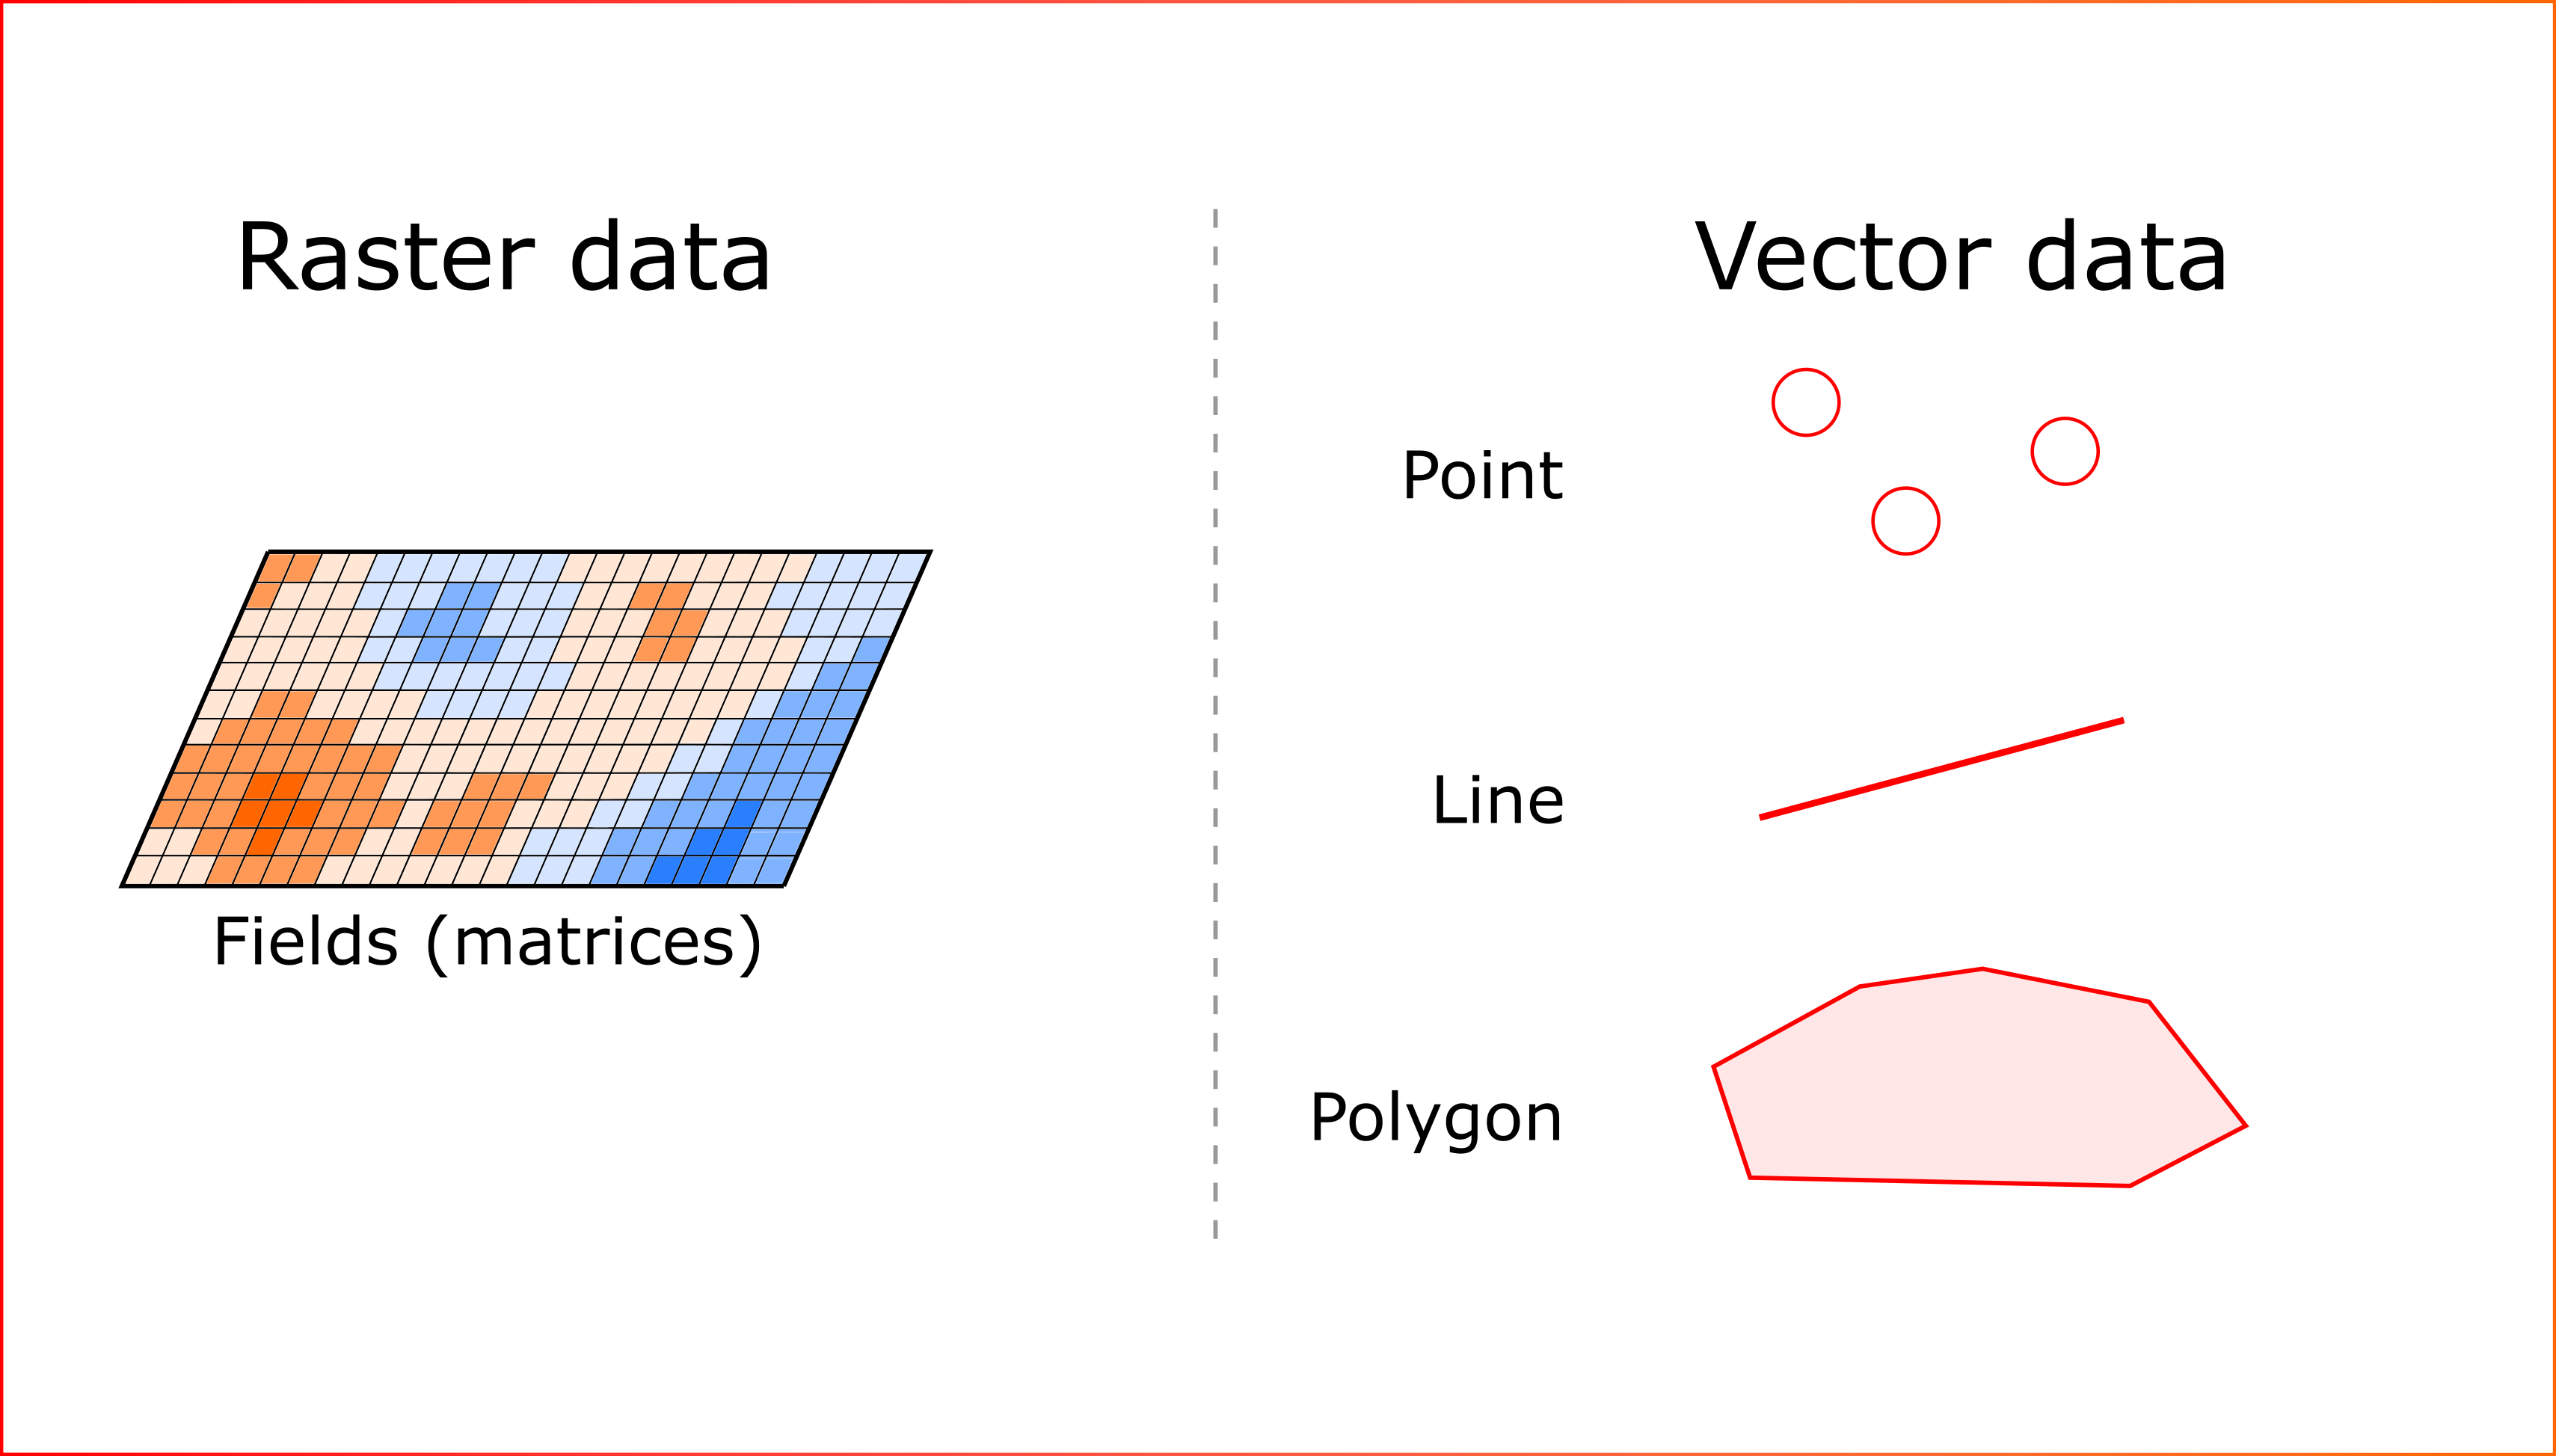
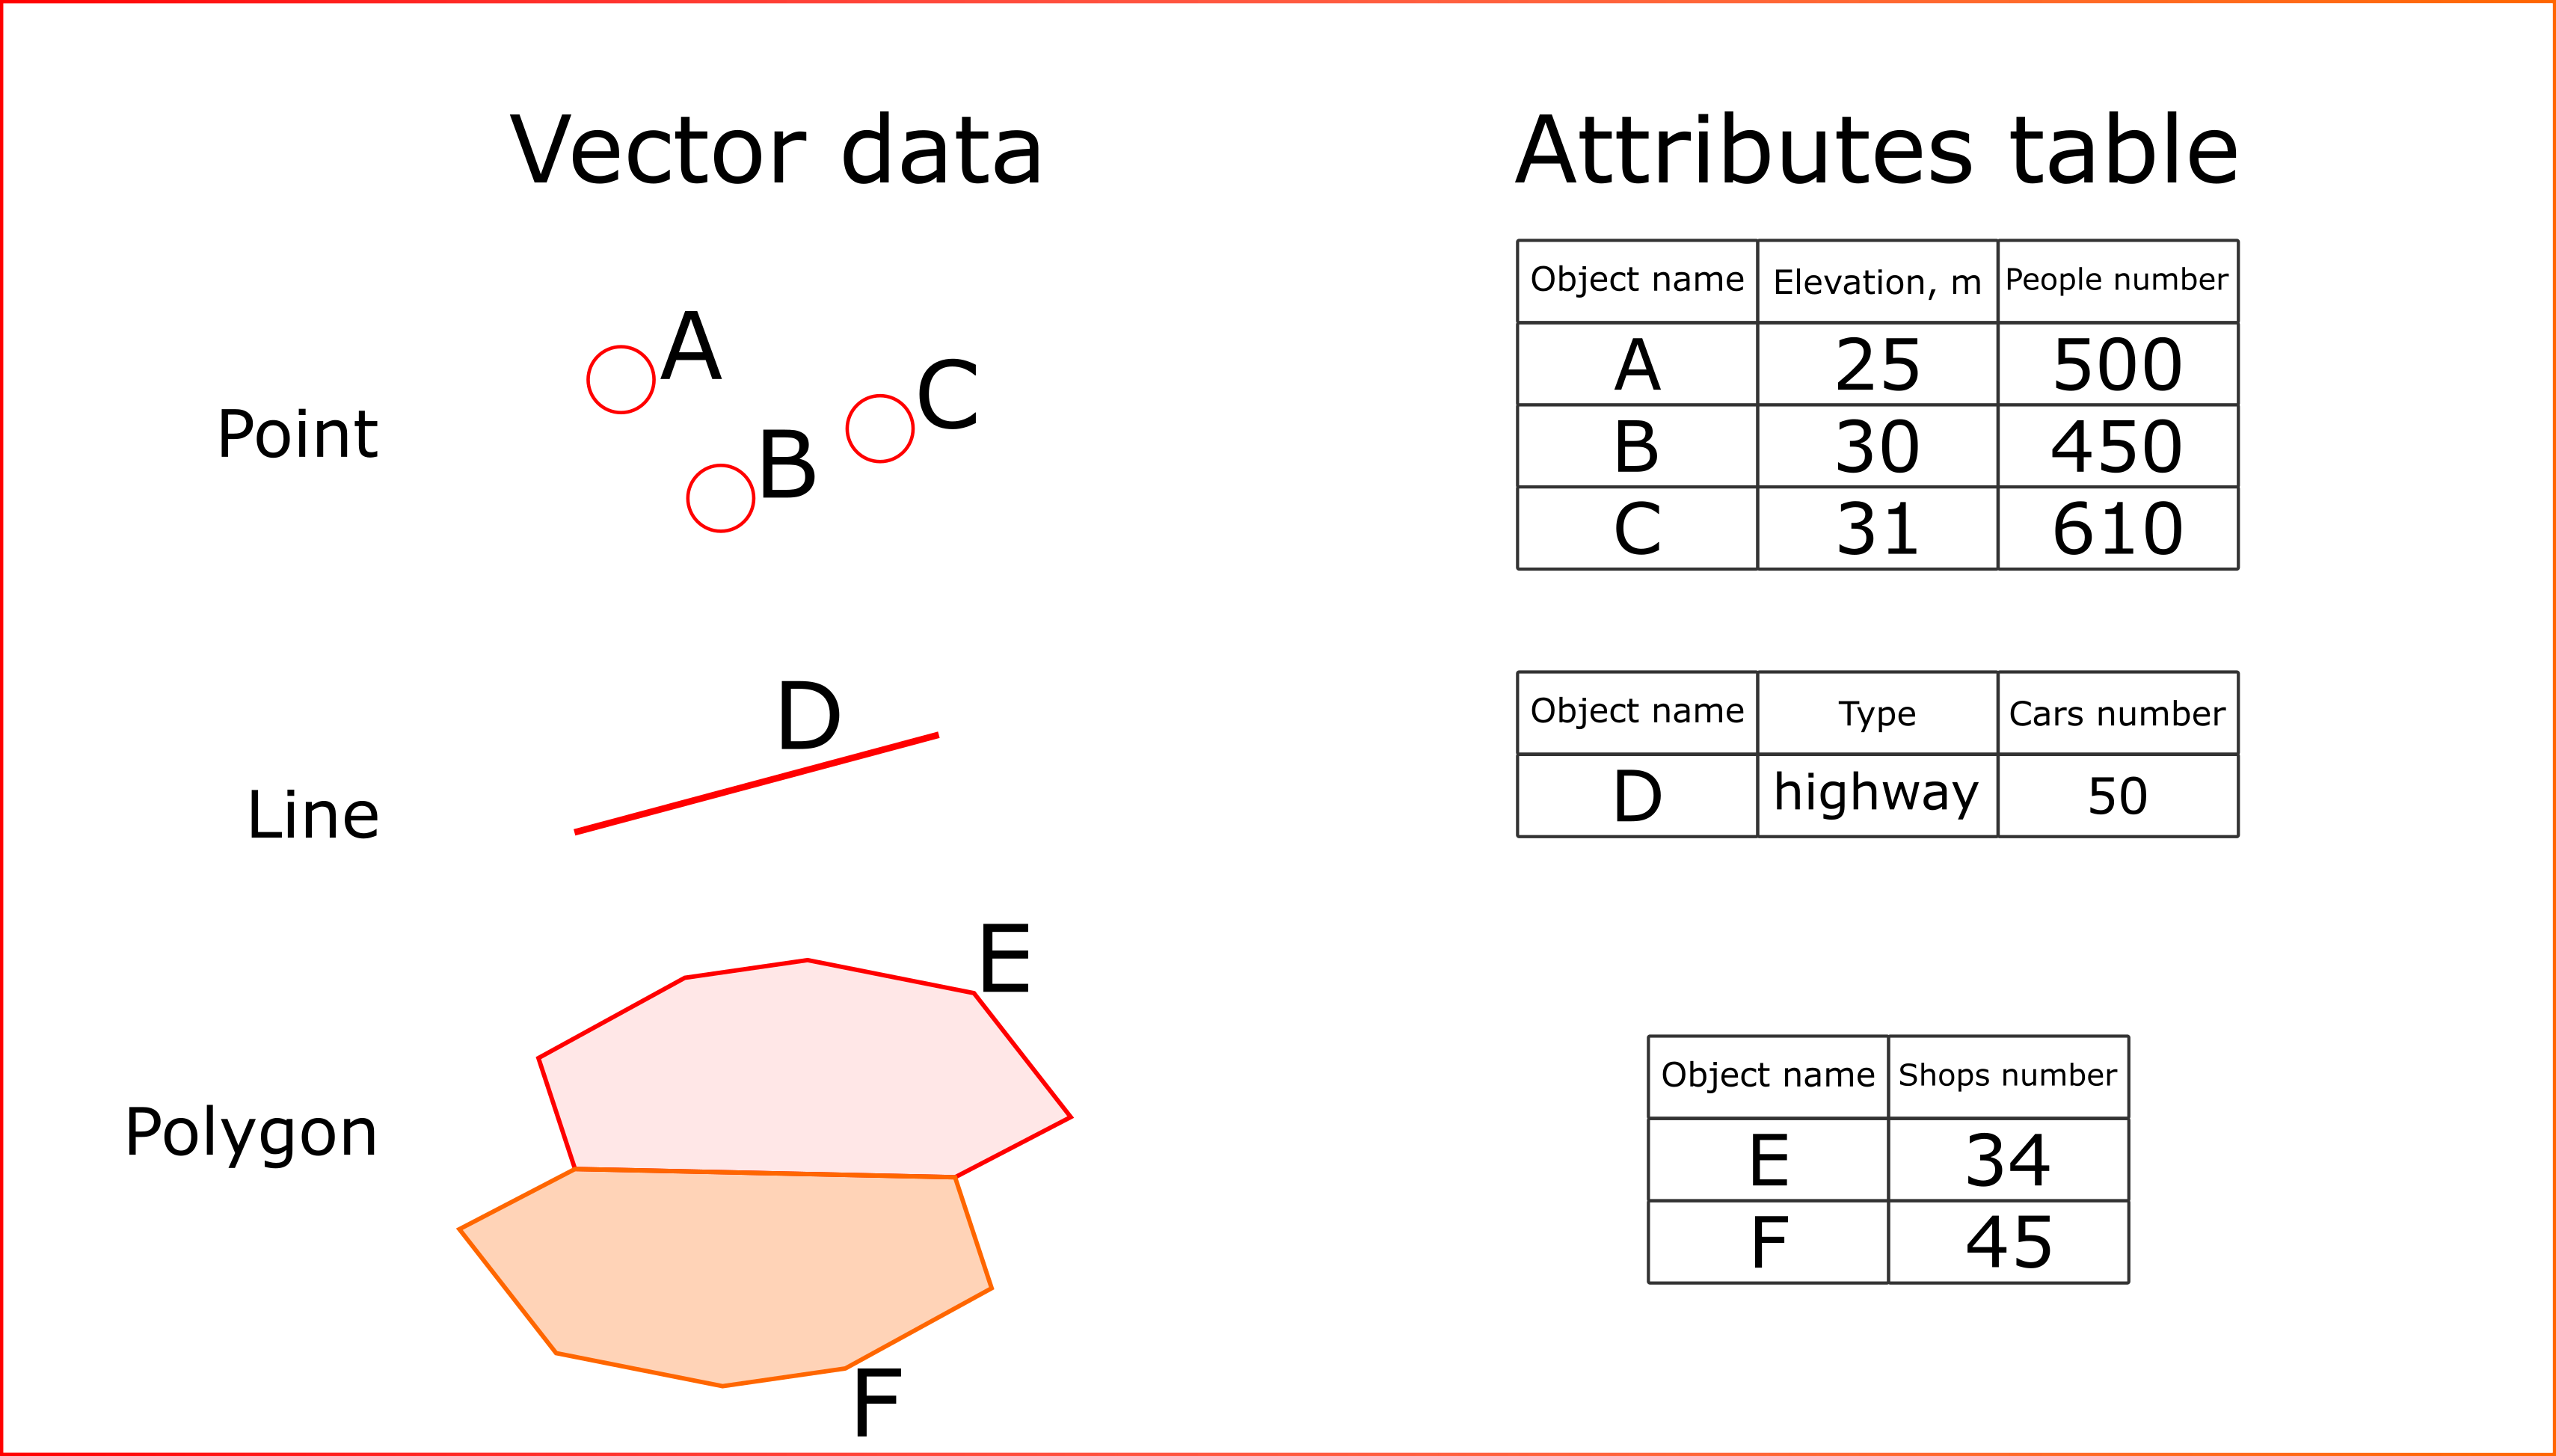
Raster data is usually a matrix of values, where each cell contains a single number. Vector data is a "geometry - attributes" pair, where for each polygon / line / point there are entries in a table (such tables are called attribute tables) with some characteristics:
The estaty library allows such data to be processed to get some insights
Concept of area of interest
estaty is designed to work with individual points on the map (provide analysis for them). It is ultimately intended to obtain metrics that characterise the surrounding of such objects. The surrounding of these objects is called the zone of analysis, or the area of interest.
Such an area defined by two parameters:
- Address for analyses or coordinates
- Radius in metres
Data loading
The easiest way to learn about estaty's functionality is to download the data. Library has native integration with OpenStreetMap data and therefore the data for the selected property can be loaded by calling the following code
from estaty.data_source.action import DataSource
from estaty.main import EstateModel

osm_source = DataSource('osm', params={'category': 'park'})
model = EstateModel().for_property({'lat': 52.5171411, 'lon': 13.3857187}, radius=2000)
loaded_data = model.compose(osm_source)

print(loaded_data)
Congratulations, you've made your first pipelines with estaty!
Area calculation
In progress
Proximity analysis

In progress